
Insights
Why is my solar portfolio underperforming? A diagnostic checklist for asset managers
A step-by-step way to find where the missing energy went, starting with the causes that most often explain the gap.
Andreas Lehner, CCO · 3 min read
Published
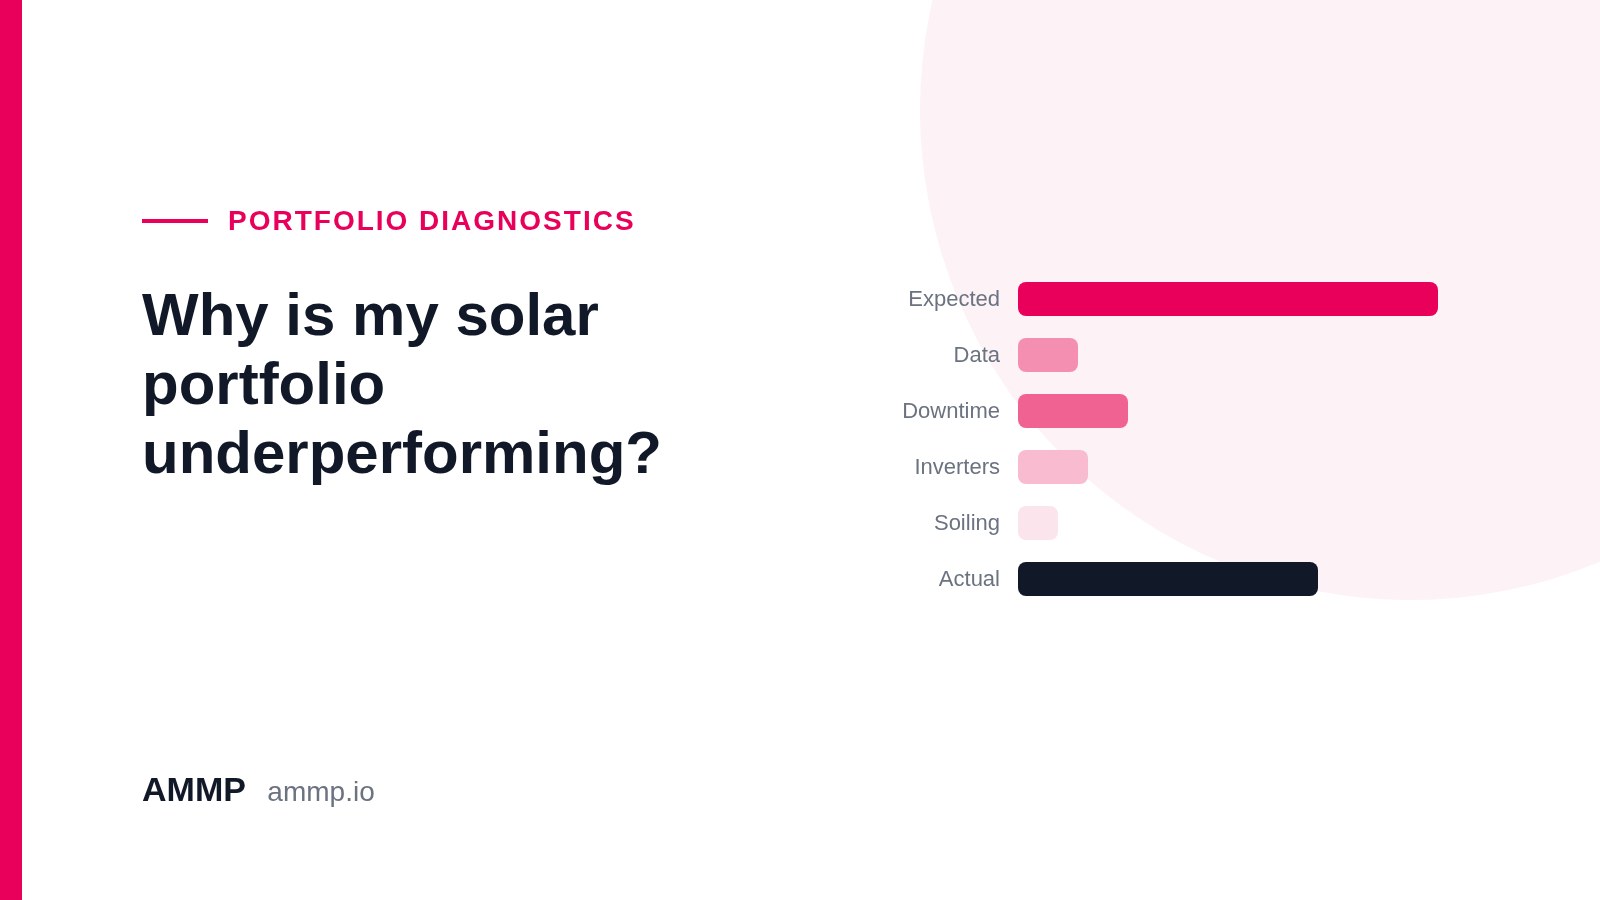
When a portfolio comes in below budget, the instinct is to blame the weather or the inverters. Often the answer is less dramatic: the data, or the budget itself. This checklist goes through the causes in the order that usually saves the most time. It uses the loss waterfall as the framework: start from the energy you expected and take away each loss in turn until you reach the energy you actually produced.
How to put a number on each loss
For every cause below, estimate the lost energy in kWh and multiply it by the tariff or PPA price for that site. That turns a technical list into a ranked commercial one, and tells you where to spend time first.
1. Data issues: missing or estimated data, wrong irradiance source
- Symptom: a site looks bad (or suspiciously good) for a month, often after a comms outage or a datalogger change.
- How to confirm: check data completeness per day, which values were estimated, and where irradiance came from (on-site sensor or satellite). A dirty or misaligned sensor makes a healthy plant look like it's underperforming.
- Cost: none in energy, but it can lead you to wrong decisions and wrong reports. Fix this first, or every later step is guesswork.
2. Grid and plant downtime
- Symptom: zero output during daylight.
- How to confirm: check grid voltage. If the grid was down, the plant couldn't export (grid downtime). If the grid was up and the plant produced nothing, it's plant downtime. With no voltage data, the cause is unclear.
- Cost: the full expected output for those hours. These are usually the biggest single bars in the waterfall.
3. Inverter downtime and underperformance
- Symptom: plant output is positive but low. One or a few inverters are behind.
- How to confirm: compare each inverter's output, relative to its share of DC capacity, against its neighbours on the same site.
- Cost: the share of capacity that is affected, for as long as it lasts. Small per day, large if it goes unnoticed for months.
4. Clipping
- Symptom: output flattens at the inverter or plant AC limit around midday.
- How to confirm: output stays within a couple of percent of AC capacity while irradiance keeps rising.
- Cost: usually small and expected by design. It only matters when it's bigger than the simulation assumed.
5. Curtailment
- Symptom: the whole plant is low, and output doesn't follow irradiance.
- How to confirm: check grid operator or customer export limits for the period, and whether the shape of the output stops following the sun.
- Cost: depends on the contract. Some curtailment is compensated, so record it separately.
6. Soiling
- Symptom: the whole plant is low, but output still follows irradiance.
- How to confirm: look for a gradual decline that recovers after rain or cleaning.
- Cost: grows over time, so compare it with the cost of a cleaning visit.
7. Degradation
- Symptom: a slow decline from year to year that doesn't recover.
- How to confirm: compare weather-corrected performance ratio for the same months over several years.
- Cost: small each year, but it compounds. Check it against the module warranty.
8. Wrong budget or baseline
- Symptom: a site misses budget every month although nothing above explains it.
- How to confirm: check the simulation behind the budget: capacity, orientation, shading, irradiance source and start date. Compare actual irradiance with the irradiance the budget assumed.
- Cost: nothing physical, but it distorts every report and investor conversation until it's corrected.
Making it routine
Run this monthly, not only when someone asks. A loss waterfall per site and per portfolio makes the order of causes visible at a glance. Then rank the fixes by revenue risk so the team works on what matters most. AMMP OS classifies losses per timestamp into these categories in the PV Loss Analysis, as part of solar monitoring.
Frequently asked questions
What is a loss waterfall?
A chart that starts from expected energy and subtracts each loss category, such as downtime, inverter losses, clipping, curtailment and soiling, until it reaches actual production.
Should I check data quality before equipment?
Yes. Missing, estimated or wrongly sourced irradiance data can make healthy sites look like they're underperforming.
How do I tell soiling from curtailment?
With soiling, output still follows irradiance but stays below potential. With curtailment, it stops following irradiance.