
Insights
How to rank solar alarms by revenue risk
A simple method for O&M and asset teams, and where AI takes over the daily work.
Andreas Lehner, CCO · 3 min read
Published
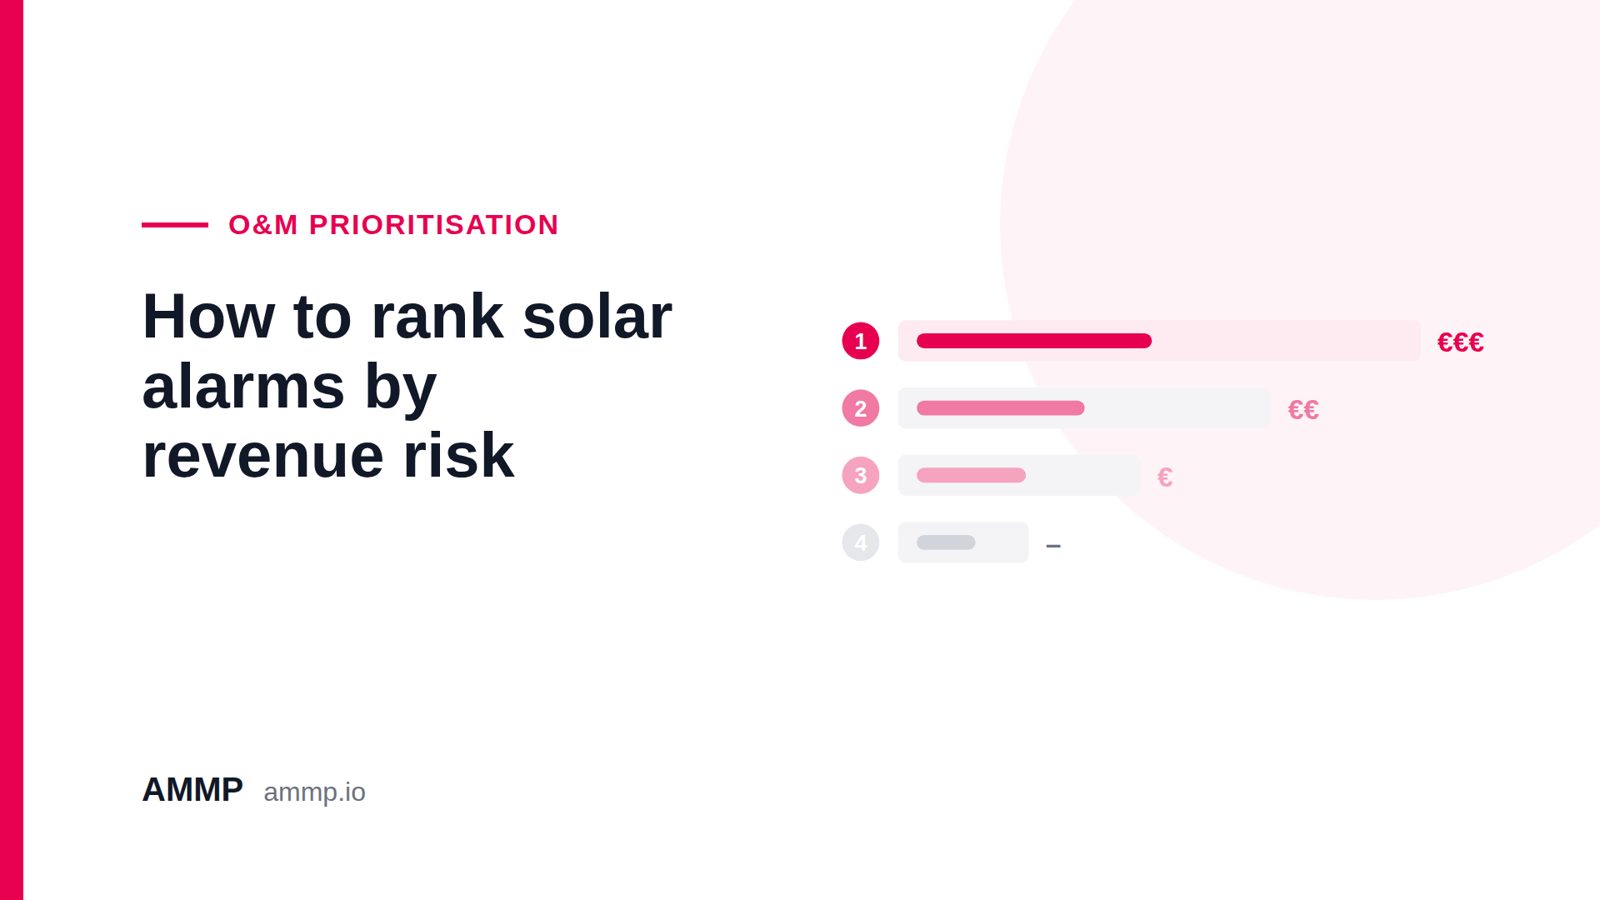
A portfolio of 200 renewable energy sites can produce hundreds of alarms on a bad day. Most O&M teams work through them in one of two ways: oldest first, or by the severity label the inverter vendor attached. Both are cheap to run. Both send crews to the wrong fault surprisingly often.
The reason is simple. A vendor's "critical" label describes the device, while your losses depend on the site: how much energy is at risk, what that energy is worth, and what the contract says happens if availability drops. Ranking by those three things takes a little more data and saves a lot more money.
The four numbers behind every alarm
Energy at risk. How many kWh will this fault cost per day if nobody acts? Estimate it from the share of the plant affected, its capacity, and the irradiance forecast. A tripped inverter on a 1 MWp rooftop in summer loses far more than a single failed string in winter.
Value per kWh. What is that energy worth at this site? Use the PPA rate or the tariff the customer avoids, including time-of-use windows. A kWh lost at 17:00 on a peak tariff can be worth several times a kWh lost at noon.
Contract exposure. Does this fault push the site toward an availability or performance guarantee? Many renewable energy PPAs carry guaranteed availability with liquidated damages below it. A fault that crosses that line costs the lost energy plus the penalty.
Time to fix. A remote reset takes minutes. A truck roll to a remote site takes a day and a technician. Quick fixes with real value deserve to move up the list.
Putting it together
The ranking itself is basic arithmetic:
Priority = (kWh at risk per day × value per kWh + contract penalty at risk) ÷ time to fix
Take two alarms that land on the same morning. The first is a string fault on a 2 MWp rooftop with a 98% availability guarantee, already at 98.4% for the month. The second is a dead weather sensor flagged critical by the vendor. The sensor alarm looks worse in the queue; the string fault is the one losing money and edging toward a penalty, so it goes first. The sensor can wait for the next planned visit.
You can run this in a spreadsheet for a dozen sites. Past that, keeping tariffs, contract terms and forecasts current for every site by hand stops being realistic, and the ranking quietly drifts back to oldest first.
Where AI helps
This is a good job for software, because the work is repetitive and the inputs already exist in your monitoring, contract and tariff data. An AI agent can check yesterday's performance across every site before the team logs on, estimate energy and money at risk for each fault, and hand the team a ranked list with the evidence attached.
Three rules keep it trustworthy:
- Every number in the ranking links to the data behind it, so anyone can check it.
- The agent proposes; your team decides what gets fixed and when.
- When data is missing or a contract term is unclear, the agent says so instead of guessing.
That's the job we built Ray, AMMP's AI coworker, to do. Ray checks every site each morning, ranks issues by operational and commercial impact, opens tickets with the evidence, and works in Microsoft Teams, Slack or AMMP OS. Ray can run on AMMP OS or on top of the monitoring stack you already use. More at www.ammp.io/ray.
Questions about your own portfolio? Write to sales@ammp.io.